
Percent change in production
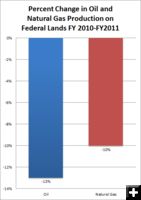
Percent change in oil and natural gas production on federal lands FY 2010-FY 2011. Blue is oil, red is natural gas. Graphic from Institute for Energy Research.
|


Fossil fuel production
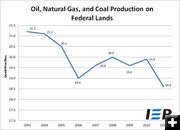
Oil, natural gas and coal production on federal lands 2003-2011. Graphic from Institute for Energy Research.
|


State, Private, Federal land production
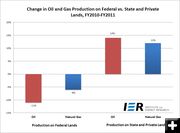
While oil and gas production has been decreasing on federal lands, it has seen a 12-14% increase in production on state and private lands. Institute for Energy Research graphic.
|
|
Total natural gas production on federal lands lowest in 9 years
Total fossil fuel production 6% less than in 2010
March 17, 2012
The Institute for Energy Research posted an article about a newly released report from the Energy Information Administration (www.eia.gov). The report, Sales of Fossil Fuels Produced on Federal and Indian Lands, FY 2003 Through FY 2011 "shows that total fossil fuel production on federal lands is falling, natural gas production on federal lands is falling, and oil production on federal land fell in 2011 ending two years of increase."
The new EIA report shows:
• Fossil fuel (coal, oil, and natural gas) production on Federal and Indian lands is the lowest in the 9 years EIA reports data and is 6 percent less than in fiscal year 2010.
• Crude oil and lease condensate production on Federal and Indian lands is 13 percent lower than in fiscal year 2010.
• Natural gas production on Federal and Indian lands is the lowest in the 9 years that EIA reports data and is 10 percent lower than in fiscal year 2010.
• Natural gas plant liquids production on Federal and Indian lands is 3 percent lower than in fiscal year 2010.
• Coal production on Federal and Indian lands is the lowest in the 9 years of data that EIA reported and is 2 percent lower than in fiscal year 2010.
Click on this link for the full story: Fossil fuel production on federal lands at 9 year low Institute for Energy Research, March 15, 2012
|


